Corellito : Help
Terminology
- Graph : The graphes you want to correlate.
- Scale : The scale you have to precise from the pictures of your graphes.
- Min / Max : The limit of correlation you define on the graphes throughout the grey area.
- Tie-point : Correlation points between the two curves.
- Export : Export of the X data from the distort curve.
Step by step
1: Click "new" and import your images
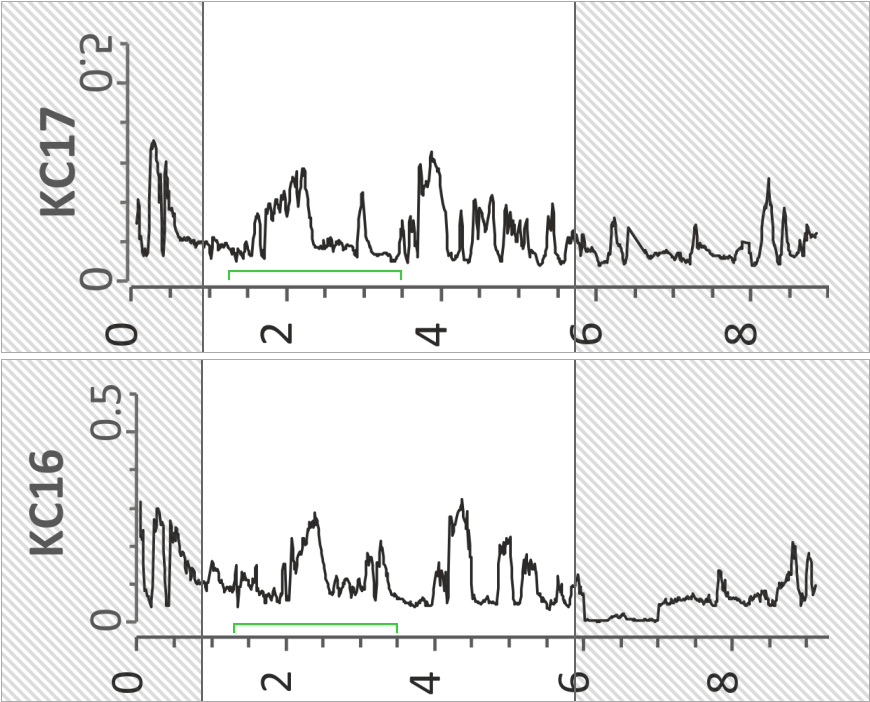
Your graphes appear in the Corellito page with a default min and max and a default scale
2: Set the min/max and your scales
To define the min and max, drag the limits to your min and max for each graph. Note that these limits are part of the correlation
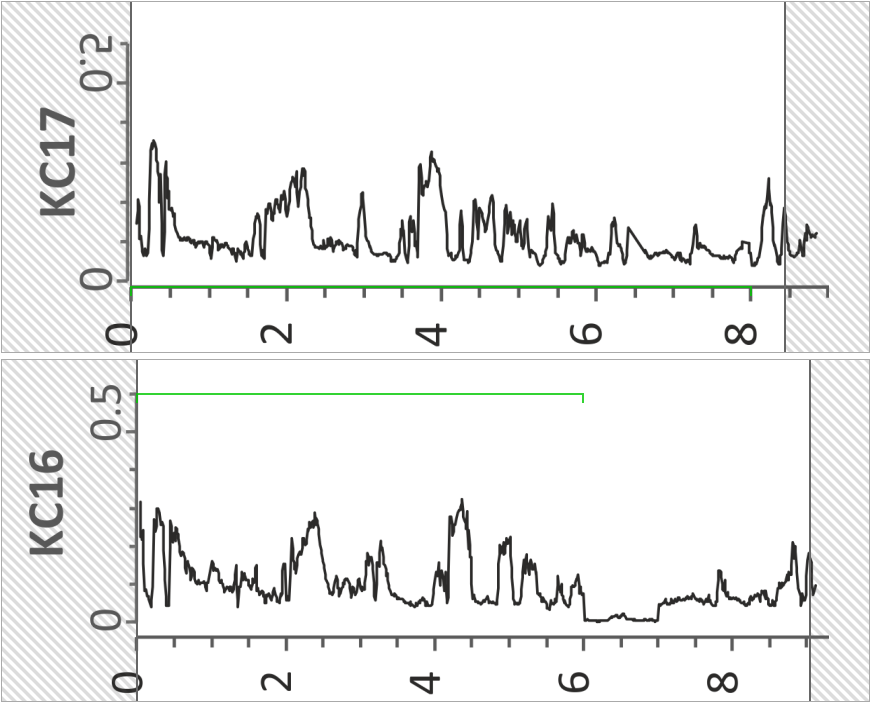
To set your scale follow these steps :
- Hover it with your mouse cursor;
- Click the green button once;
- Move your mouse to the starting point of your graph and click it to define the start of your scale;
- Move your mouse to the end point of your scale and click to define it to define the end of your scale;
- Hover the min input to define the value (leave your cursor above the input while you are writing the value); Repeat the same process for the max.
3: Add your tie-points
To add your tie-points, double-click on the graph. If you know the X-value of the point you choosed, you can write it in the case at the top of the tie-point.
Note that you can use the browser zoom in / zoom out with CTRL + Mouse Wheel UP/DOWN to improve your precision !
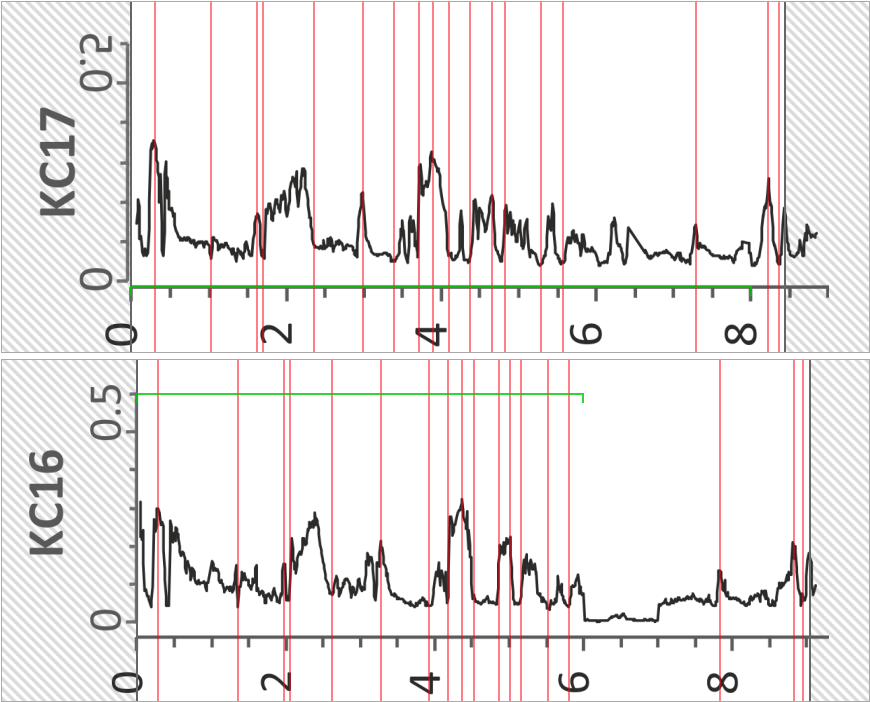
When your mouse hovers a tie-point, the corresponding one on the other graph is highlighted.
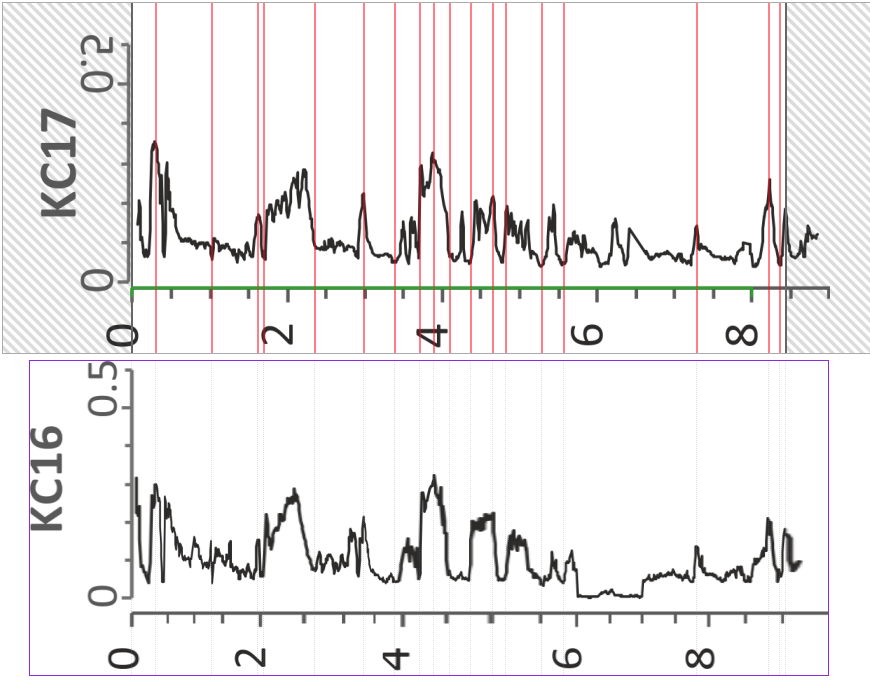
4: Correlate!
Click the Apply Correlation button change your original graph to a correlated graph !
5: Export data
Use the screenshot function of your PC if you want a picture (that's the easiest way, it implies that you need very large original images to avoid blurry scaling).
You can also use the Export button to have your new X values.